The OneView Dashboard is a collection of colored boxes. The boxes are placeholders for all the data points that OneView collects. You can write anything in the boxes. You may add as many boxes as you like and as many data points in each box as you like.
![]() Dashboard Basics – The Green Boxes
Dashboard Basics – The Green Boxes
The overall structure of the dashboard is as follows.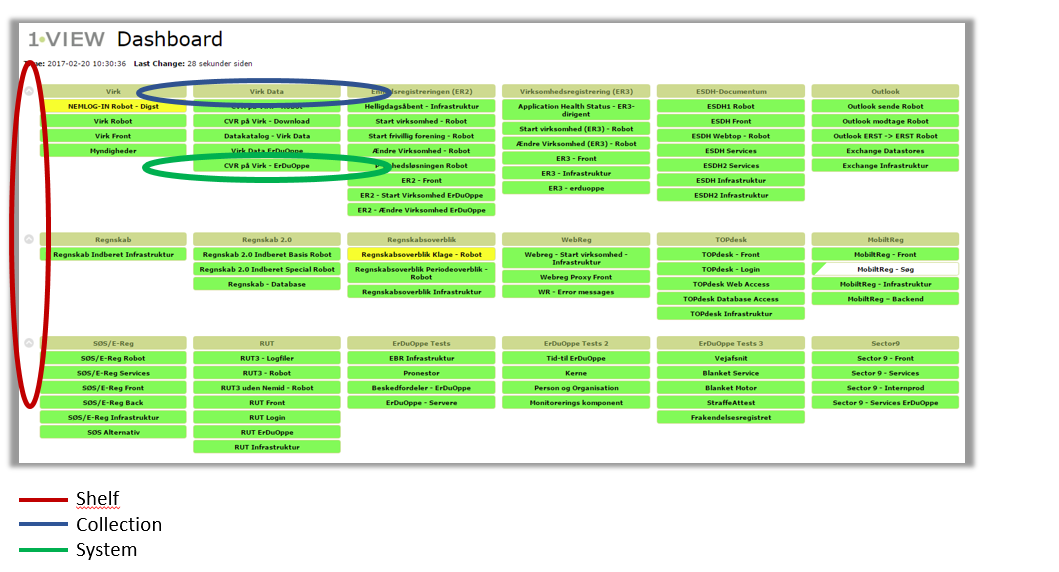
- Shelves
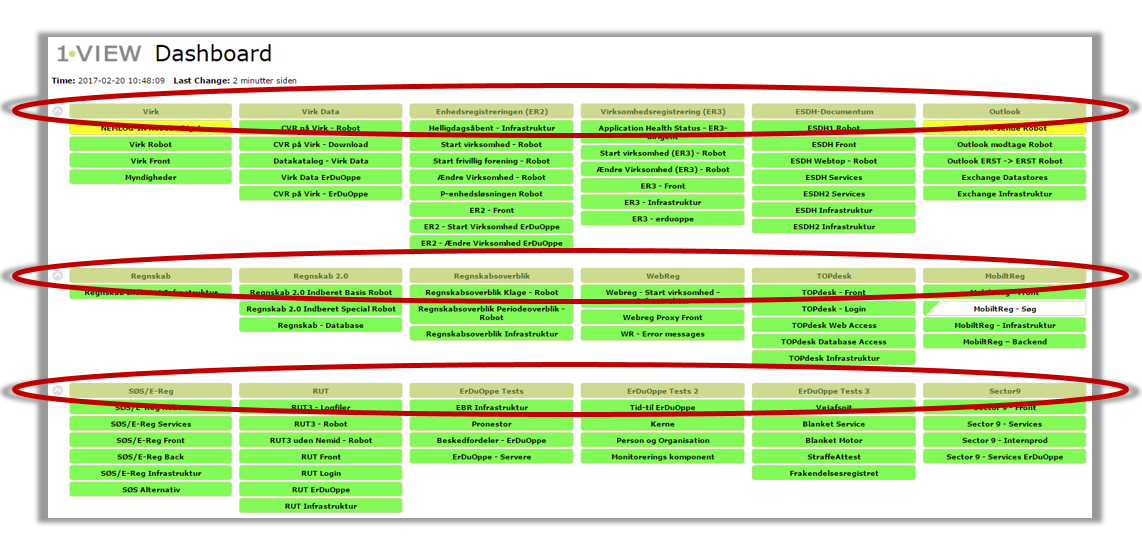
The dashboard is divided into one or more shelves just like a bookshelf. The blue demo dashboard has two shelves and the dashboard above has seven shelves. The shelves are by default expanded but they can be collapsed one by one if you want using the small arrow to the left of each shelve.
Click the thumbnail below to view several shelves on a dashboard.
- Collections
On each shelf you find a number of collections. Each collection can hold one or more boxes. Each collection has a name that you find on top of these boxes.
Click the thumbnail below to view a number of collections on the dashboard. Note that brown boxes are collections.

- Systems
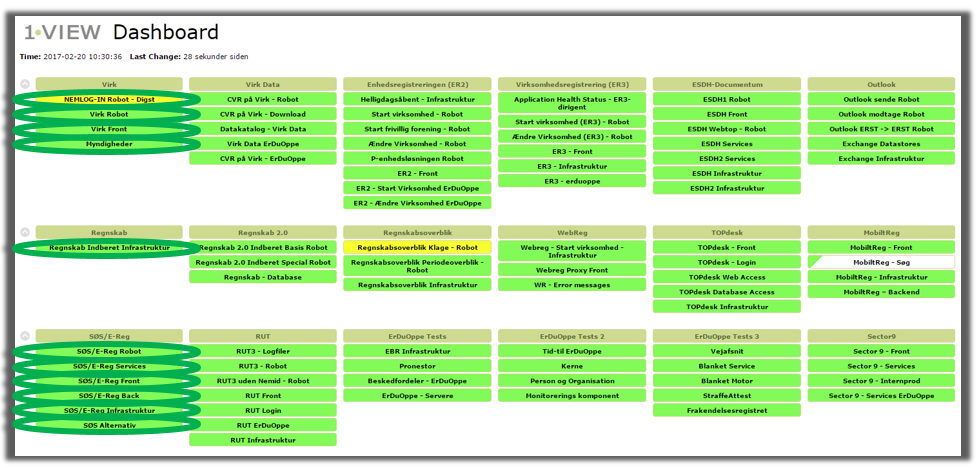
The boxes below the collection are called systems. Systems can contain subsystems and on the lowest level domains. The coloring of the systems indicate the status. Systems can assume the following four colors: Green, Yellow, Red or Blue.
Click the thumbnail below to view a number of systems on the dashboard – note that all boxes below the collections are considered systems. Click to enlarge.
- Domains
Inside a system more subsystems and domains can co-exist. A domain cannot be seen directly from the dashboard – it is necessary to click a system to view domains below this particular system.
A domain is a collection of transactions as seen from the image below. Several domains can be contained in a system. Click to enlarge.
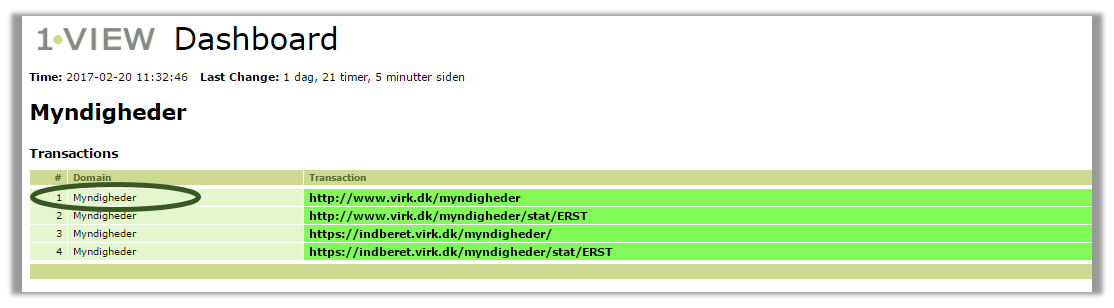
- Transactions
A transaction is the data that OneView uses to calculate the status color in the boxes on your dashboard. Study the next section in order to get more details on transactions.
Click the image and view the information provided on transaction level.
![]()
What is a transaction?
A transaction could be an http request made by OneView to test response time when loading the front page of your company Intranet portal. If OneView makes this request once every minute then you have one data point every minute that OneView can use to tell you if your company Intranet portal should have a green status.
If OneView reads the access log files from your company Intranet portal OneView will have several data points every minute during daytime because your end users access the Intranet portal continuously, and one data point each minute during the night due to the automated http request test.
All the other pages on the Intranet portal will give you further transactions if the users access those pages. All these transactions go into the “Intranet portal domain” placed in the “Intranet portal system” placed in the “Intranet portal collection” on a shelf on your OneView dashboard.