OneView provides you with an overview showing you if users can work efficiently with your IT systems.
OneView can monitor all systems across all platforms and provide you with a 100% overview in one single dashboard.
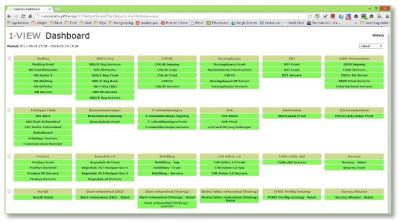
![]() 100% Overview (English version)
100% Overview (English version)
![]() 100% Overblik (Danish version)
100% Overblik (Danish version)
Overview
In case of problems OneView will guide you in the right direction and help you deploy your specialist technical tools to pin point and solve the problem at hand.
The best way to start is by monitoring the systems that are most important to your business.
We recommend that you start out by using the data that may already be available to you. Get started fast, make a few baselines and expand the measurements over time. We call it 80/20.
Try not to get tempted to over implement and get stuck in planning your wall to wall monitoring solution. Jump start your monitoring by using the data you already have. A lot of applications save response time measurements in log files or databases.
Passive Monitoring
One example of such data is access log files on web servers. Each web server holds one current log file. OneView reads these files across all your web servers thus delivering valuable live input data to your OneView Dashboard. This is real end user response time.
This kind of data may be collected from all your browser based IT systems. OneView helps you collect your own data!
Combine the response time data with technical measurements in your dashboard and you have a powerful tool that will guide you in the right direction whenever your OneView Dashboard highlights a problem that affects end users.
Active Monitoring
OneView can do a range of active measurements that will be a supplement to your end user response times from the log files. Some examples of active tests are connection tests, web requests and full scripted end user flows in browser based systems and classic thick client-server systems.
This is why OneView can actually monitor all systems across all platforms.
Scripted tests
Scripted tests will deliver data to you even when there are no users on the system that you monitor and you know exactly what your script is doing. Therefor scripted tests are traditionally used for SLA reporting. The downside of scripted tests is that every time the system you monitor change you need to adjust the test scripts.
Logfiles
Log files holds the response time of every single transaction that users are making in the system you monitor so you will get the full picture of what is delivered to the users. The end users will use your system even after a major new release and the log files are typically unchanged. Because of that you typically do not need to adjust the part of your OneView monitoring that is based on log files.
OneView gives you the best of both worlds both active and passive monitoring.